
So, you’ve collected a considerable amount of data for your company, and now you’re wondering how to harness its potential.
How can we gain additional insights from this data? Or, what other questions can we ask based on the data?
These are the challenges every company faces on its journey to becoming data-driven. Without a data-thinking mindset, decision-makers may encounter various struggles along the way.
What is Data Thinking?
Data thinking is a thinking mode or a framework that allows us to judge, think, and analyze based on data in different situations and solve business problems.
Developing a data mindset requires not only theoretical or technical capabilities but also a keen sense of data sensitivity, intuition, and real-life experience accumulated over time.
Therefore, developing data thinking is not easy. It is the result of long-term practice and knowledge on the part of data analysts.
Why is Data Thinking so Important?
Data thinking is crucial because it allows us to approach data problems in a structured and logical manner, which is especially important when dealing with complex business scenarios.
With a vast sea of data, it is easy to feel overwhelmed and unsure of where to begin. However, with data thinking, we have frameworks to reference and know which methods and frameworks to apply in different situations.
Moreover, possessing data thinking helps us understand which tools and technology to use for different scenarios. Regardless of the specific tool chosen, the ultimate goal and desired outcome can still be achieved.
In contrast, many companies invest heavily in advanced technology and high-end analytical data tools, but due to a lack of data thinking, they often fail to see the expected returns or benefits from these investments.
Hence, data thinking is crucial as it guides us in selecting the right tools and methods for different business scenarios, ensuring efficient problem-solving through data analysis.
However, in many small and medium-sized enterprises (SMEs), there is often a lack of both technical expertise and talent in data thinking. Is there a way for SMEs to establish a systematic data analysis framework without struggling?
The answer is yes. In this article, we will discuss a few fundamental data analytics concepts and frameworks that SMEs can readily adopt for their business data.
In subsequent blog posts, we will delve into how to cultivate data thinking and explore in detail common data analysis methods such as funnel analysis, churn analysis, user conversion analysis, and more.
To stay updated, don’t miss subscribing to our Email Newsletters.

[mailerlite_form form_id=3]
When we talk about fundamental analytical methods, we are referring to some common data thinking frameworks that do not involve advanced mathematics or statistics. These methods can be universally applied across various business scenarios.
Before delving into the basic analysis methods, a critical reminder is that any analysis should always consider the business context, as this significantly influences the outcomes and conclusions drawn.

What are the Fundamental Data Analysis Methods?
Throughout the data analysis process, three essential concepts play a significant role:
- Comparative Analysis
- Classification and Grouping
- Correlation and Causation
Comparative Analysis
If you do not compare, you can’t see the problem.
Without comparison, we wouldn’t know which product or feature performed better, what our customers prefer, or how we were doing compared to our competitors.
Data analysts typically make two comparisons – comparing with their own numbers or comparing with the overall industry.
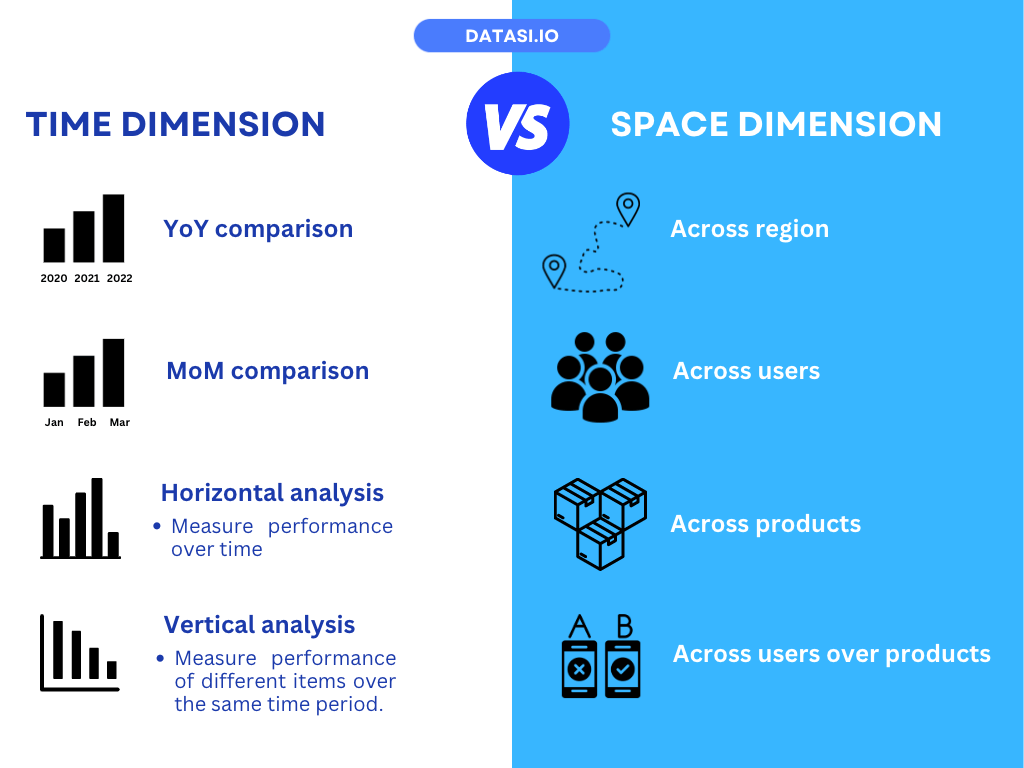
We can use comparative analysis to compare the difference in size, or a trend and fluctuation.
To compare the difference in the overall size of the data, we can use average value, and median for the comparison, or compare with industry benchmark across a time span.
To compare the overall fluctuation of the data, we can compare the coefficient of variation, standard deviation, or variance across different periods.
Lastly, to compare a trend, we can compare across time dimension or space dimension.
One thing to note is that you should refrain from using absolute numbers for comparison. Only when you convert it to ratio, then you can interpret the number, and compare it with other metrics, such as the industry benchmarks.
A/B Testing
A special kind of comparative analysis method is A/B testing.
A/B testing, also known as split testing, is an online test method used by data analysts to compare which version of a webpage or app works better or attracts more engagement from users.
It’s also considered to be one of the most effective methods to explore the causal relationship between variables.
A/B testing is generally conducted in an 8 steps process.
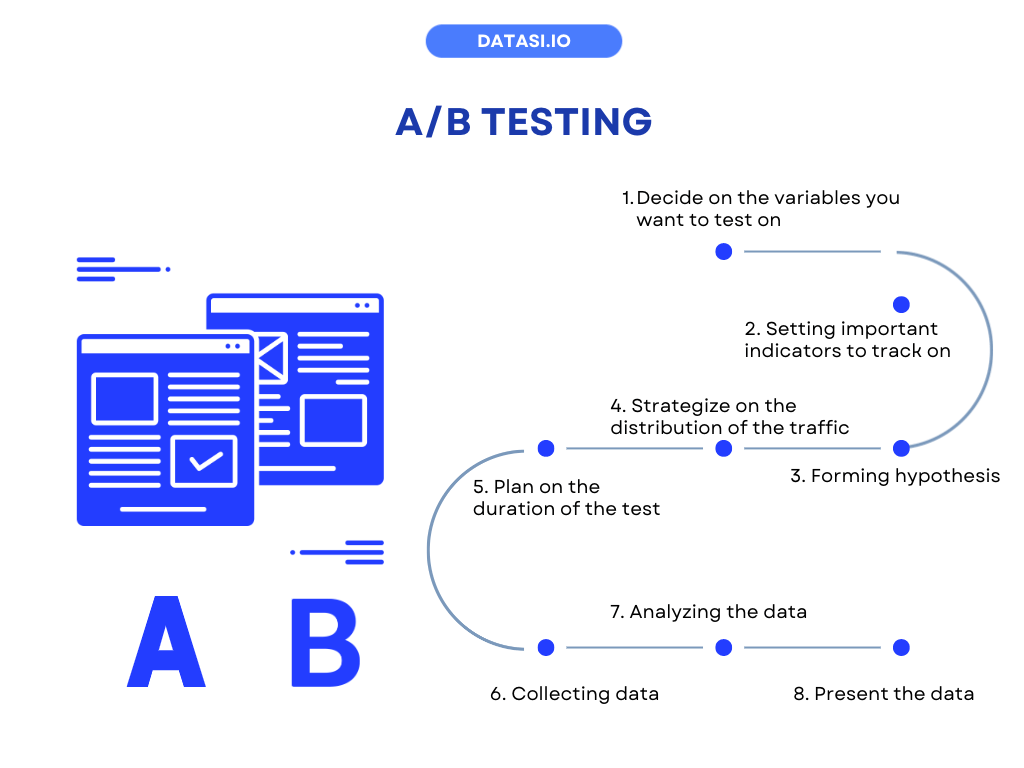
For instance, if you have created 2 landing pages on your app for the users and want to know which one works better. You can first:

1. Identifying the variables/features to test
Different landing pages for the audience with different call-to-actions.
2. Setting important indicators to track on
Which pages have higher click-through rates and average time on page? What action did the user further carry out? (eg. made a purchase, deleted the app)
3. Forming a hypothesis
Ahypothesisis a prediction you create prior to running an experiment. The hypothesis we can formulate here is to assume the users will click through the new landing page more.
4. Strategize on the distribution of the traffic
Ensure the users in the testing and control groups are as similar as possible and distributed evenly.
5. Determining the test duration
The duration of the test should be long enough to prevent any novelty effect. When the new landing page is first set up, the users might be curious, so they clicked through and tried the new features. But as you increase the test time, you can see the results fall back to an average as before.
So the duration of the A/B Test is crucially important and is long enough for repeat customers to no longer be surprised by the new feature.
6. Collecting data
Start the experiment and collect the data.
7. Analyzing the data
This is the part that requires technical and statistical knowledge from the data scientists to ensure the difference between the two groups or the results is statistically significant before drawing your conclusion.
Classification and Grouping
The second fundamental analytics concept we want to talk about is classification and grouping.
To analyze the problem a little bit further, we can break it down into sub-problem or into sub-parts for further analysis.
For instance, when we are analyzing the conversion rate of the users. We can break down the users into sub-groups based on different criteria and analyze the conversion rate individually.
There are 4 ways we can group our users or audience to conduct further analysis:
1. Grouping based on demographics (age, location, gender, income, employment status)
We can break down the user group by their demographic information including age, race, marital status, gender, ethnicity, education, and many more by collecting them through surveys or sign-up forms.
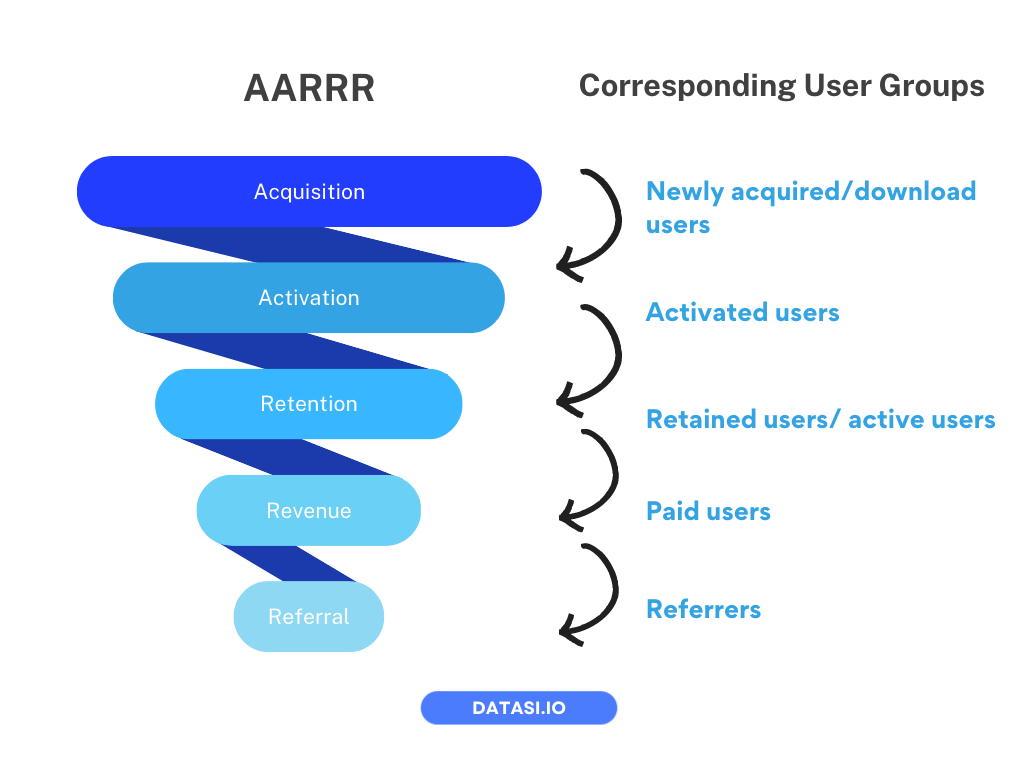
2. Grouping based on user journey or stage in the sales funnel
We can also group the users based on their stage in the sales funnel and analyze the behavior patterns in each of the sub-group. We are using the AARRR model here as an illustration of the corresponding user groups you can break down based on the sales stages.
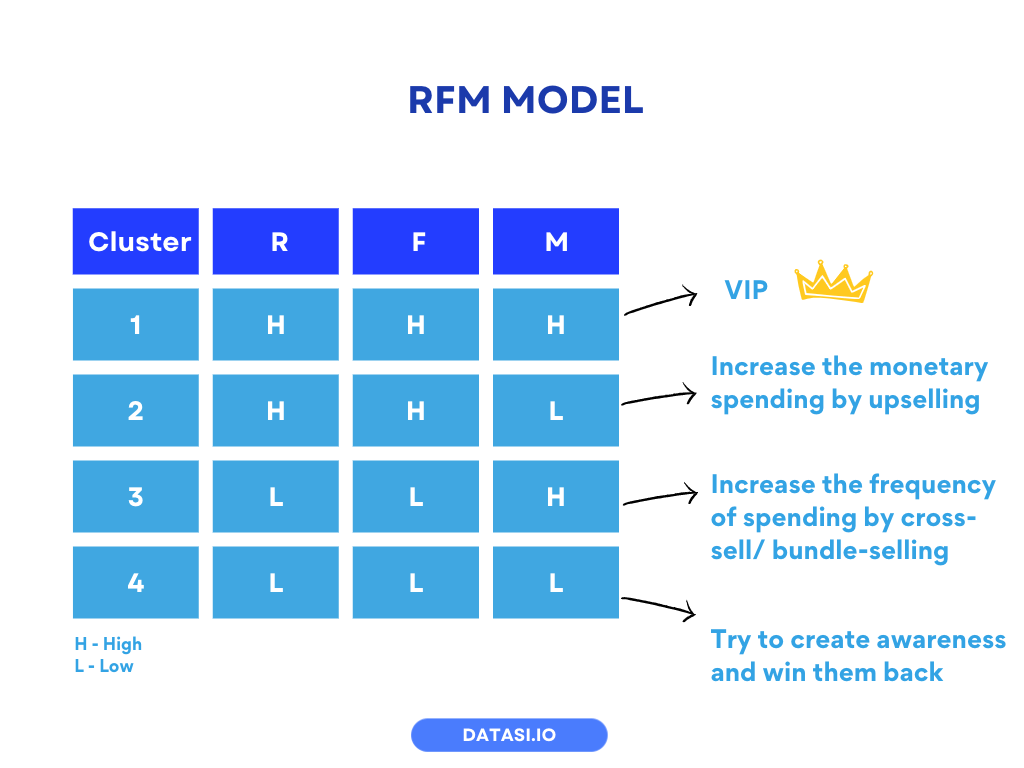
3. Grouping based on activeness or spending with the company using RFM (Recency, Frequency, Monetary) model
If you want to further analyze your customer based on their activeness and spending with the company, you could first use the RFM model to group your customers into different tiers, then analyze each tier accordingly.
RFM model is conducted by ranking each customer in terms of the 3 dimensions – recency, frequency, and monetary spending with the company, and grouping them into the different clusters as illustrated below.
4. Machine learning-based classification for predicting class labels
Machine learning algorithms such as K-means can also help to group customers into distinct groups of individuals that have similar characteristics, which will not be elaborated on in this blog post.
After you have achieved customer classification, you can understand each customer group’s behavior and preference better, then strategies from a business perspective. Including:
- What are the corresponding strategies for each customer segment?
- Who are the high-value users? How much is it worth for my investment?
- Which channels can I find these high-value users, and how should I capture these high-value users?
- Among the existing users, who are still active, and who has churned?
- Can I activate the existing low-value users? How to activate them?
Correlation and Causation
The last common fundamental analytics concept we want to talk about is correlation and causation.
In the process of exploring the relationship between variables, correlation analysis is a more commonly used analysis method.
Correlation analysis, also known as bivariate, is used to find out if there is a relationship exists between 2 variables and the magnitude of the correlation.
There are many variables in business that you might be keen to know their relationships in order to strategies.
For instance, whether the increase in advertising spending can lead to an increase in sales. Or whether higher click-through rates can lead to higher purchase behavior. These are all important insights for the decision makers to optimize and strategies.
Correlation can be measured by the correlation index and also by plotting scatterplots and visualizing the relationships.
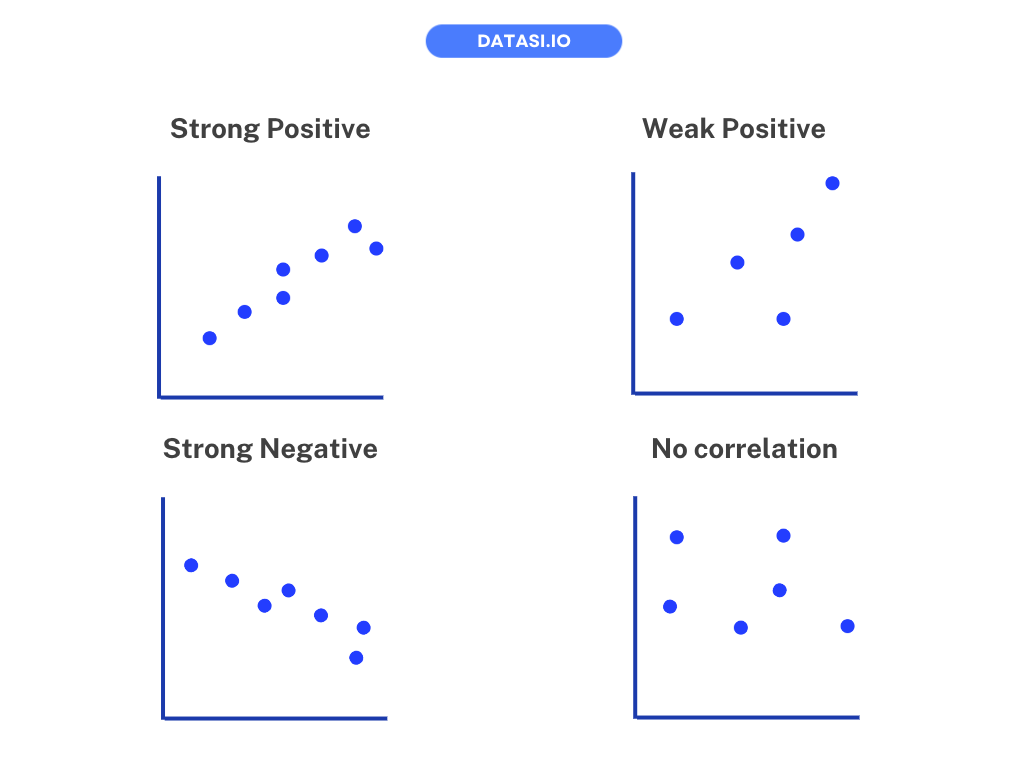
However, correlation does not mean causation. The former indicates a relationship while the latter indicates that one causes the other event. It’s important to differentiate between the 2 terms. One way to test causation would be through conducting randomized controlled experiments such as A/B testing.
After knowing the relationship between the variables, you can better strategies your business decisions.
Conclusion
Today’s post summarizes several common data analysis frameworks and methods. The actual methods and theories cannot be summarized in one article. Knowing which techniques, tools, or frameworks to use in different scenarios requires long-term practice and experience.
You don’t have to do it all by yourself.
Choosing the right tools and help can get you to your goal faster and more effectively.
Our data experts are here to offer the support you need. Together, we can journey into a data-driven future and unlock the full potential of your business!

Talk to us today
Find out how we can help your business to build a successful data strategy.