
In the world of data-driven decision-making, the right Business Intelligence (BI) tools can be a game-changer for your business.
However, with a multitude of options available, it’s easy to feel overwhelmed.
In this guide, we’ll walk you through the process of choosing the right BI tools tailored to your specific business needs, helping you make informed decisions.
What are Business Intelligence (BI) Tools?
Before we dive into the selection process, let’s clarify what Business Intelligence (BI) tools are.
Business Intelligence (BI) tools or software encompasses the technical infrastructure that empowers businesses to collect, store, and analyze data generated by their operations.
BI tools simplify data access, analysis, and presentation through visual formats like reports and dashboards.

By utilizing a BI tool, an enterprise can implement a data strategy in a much more straightforward manner, making it easier for decision-makers to uncover valuable trends and insights from the data. This, in turn, enables more efficient and accurate decision-making processes.
Why Does Your Business Need BI Tools?
As your business accumulates more data, transforming it into actionable insights becomes imperative for effective decision-making. Manual data entry, handling large datasets, and periodic data analysis can hinder efficiency and lead to missed opportunities.
BI tools offer solutions to these problems by providing real-time analysis and abundant insights, significantly enhancing productivity and decision-making capabilities.
Here’s why BI tools are crucial:
1. Real-time Analysis
A well-configured BI tool can provide real-time insights, which is particularly valuable when your business data is frequently updated.
This enables efficient decision-making without the need to wait for days or weeks to review statistics.
Efficiency and agility mean everything in today’s business world. Do not waste your precious time on the manual processing task when BI tools can help you to speed up the process.
Additionally, most BI tools offer access from multiple devices, ensuring that you can view your data insights 24/7, anywhere, anytime. How powerful is that?

2. Powerful Visualization
Do you know that visuals can help you to possess information much more effectively? In fact, visuals can even improve your problem-solving efficiency by more than 19%.
If you want to save up all the energy from possessing difficult information, use visuals!
BI tools typically offer robust visualization features that make it easier to interpret complex data, preventing you from feeling overwhelmed by a sea of numbers. Visualizations not only benefit you but also assist your team members in better understanding the information at hand.
Read here for more on data visualization and the powerful features of BI data visualization dashboards.
3. Wealth of Insights
BI tools can provide you with abundant insights.
They enable you to track, analyze, and forecast performance, such as monitoring sales performance, identifying operational inefficiencies, or tracking profitability and expenses.
By consolidating all metrics onto a single dashboard, BI tools greatly enhance your business’s efficiency and productivity.
4. Centralized Platform
Many companies have the issue of data silos. They store their data in various locations, databases, or systems, which can be time-consuming and prone to errors when monitoring separately.
BI tools provide a centralized platform where all your data resides as a single source of truth, enabling streamlined decision-making processes for the entire team.
5. Efficiency and Collaboration
If you are still relying on manually produced data reports or waiting for other team members to share them with you, you need a more efficient tool that can prevent spending time on all these repetitious manual tasks.
BI tools facilitate easy collaboration and eliminate the need for repetitive manual tasks. It can generate automated reports based on your desired frequency. You can also download and view specific sections of the reports separately.
By saving time on manual tasks, your team can focus on creative or customer-centric activities that add more value to the company.
6. Predictive Analysis
BI tools can help you predict future trends based on past performance or historical data, allowing for insights into business strategies and early planning.
7. User-Friendly
Most BI solutions are designed to be user-friendly, offering various data connectors that allow integration from different sources, including local storage or cloud databases like Google Analytics or Salesforce.
You don’t need extensive technical skills, including coding, to use a BI tool, making it easy and feasible for small and medium-sized enterprises (SMEs) to maintain and operate.
Which Business Intelligence Tools Are the Best?
Now that you understand why BI tools are essential. Let’s explore four commonly used options.
Each tool is suited for companies of different sizes and business needs. You can match it with your needs to choose the right BI tool for your business.

[mailerlite_form form_id=3]
1. Tableau
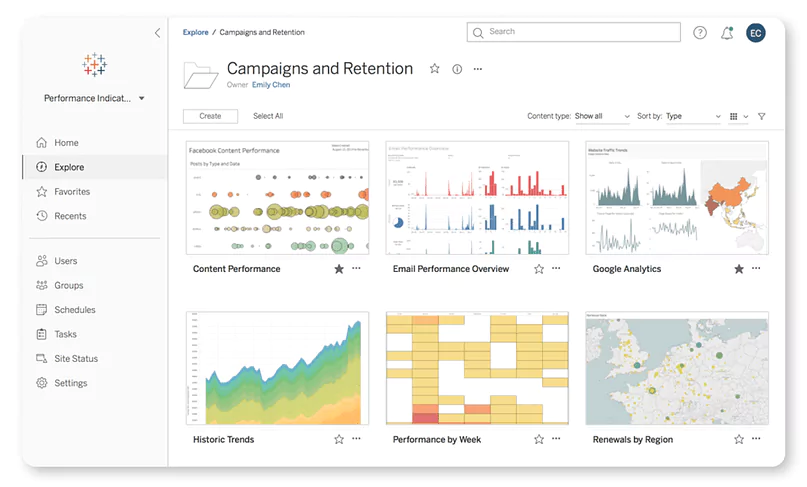
Tableau is a powerful data visualization tool that allows you to connect with multiple data sources and create interactive dashboards, reports, and charts.
Key Features of Tableau:
- Drag-and-Drop Interface: Tableau offers a drag-and-drop interface that makes data analysis and visualization accessible to users with varying technical skills.
- Versatile Data Connectivity: It supports numerous data sources, from Excel files to web analytics services and CRM systems.
- Interactive Dashboards: The best part of Tableau is that it allows you to create interactive dashboards and reports that allow users to explore data and gain insights effortlessly.
- Robust Data Visualization: Tableau offers a wide range of visualization options, from bar charts and pie graphs to heat maps and geographic maps.
- Real-Time Data Updates: You can always stay on top of changing data with real-time analysis and updates.
- Community and Support: Tableau has a vibrant community and you can benefit from robust customer support.
- Scalability: Highly suitable for both small businesses and large enterprises.
Cons:
- Costly: Even for an individual account, the monthly license fee is approximately $70.
- Advanced Features Require Technical Expertise: To fully leverage advanced features, users may need some technical expertise.
- Data Governance and Security Limitations: Some users find that Tableau’s data governance and security features are limited compared to other tools.
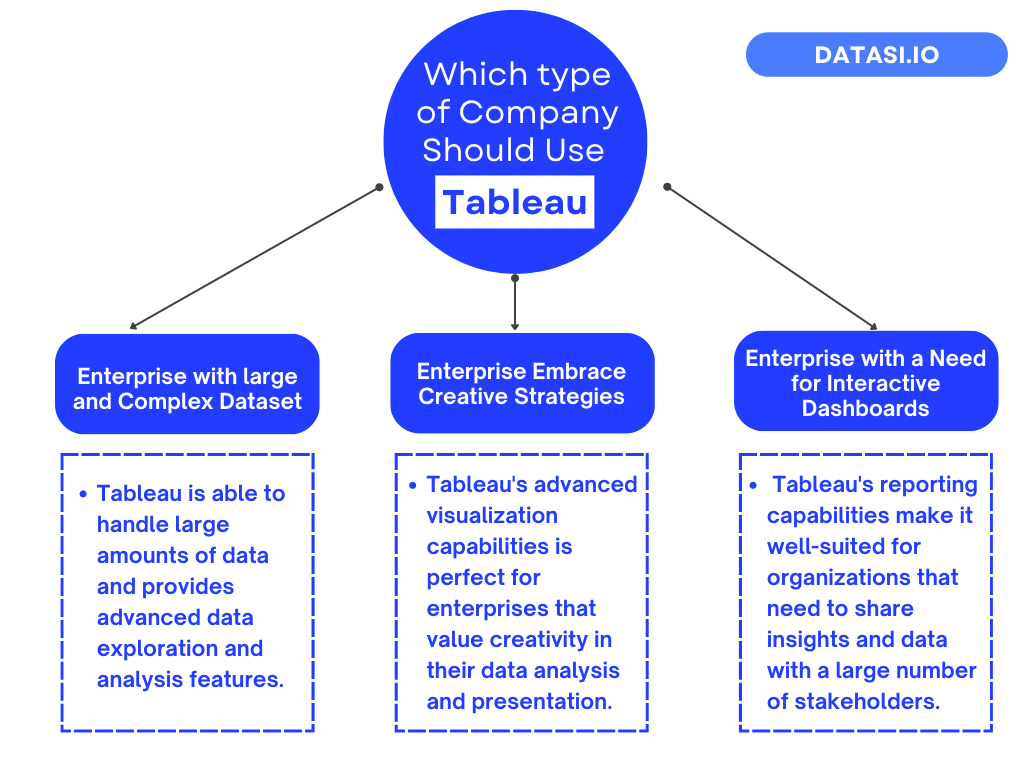
In summary, Tableau offers advanced data visualization and exploration capabilities, making it suitable for organizations in need of powerful data discovery and analysis features, as well as complex data visualizations.
We recommend the following companies adopt Tableau as their BI tool:
2. Power BI
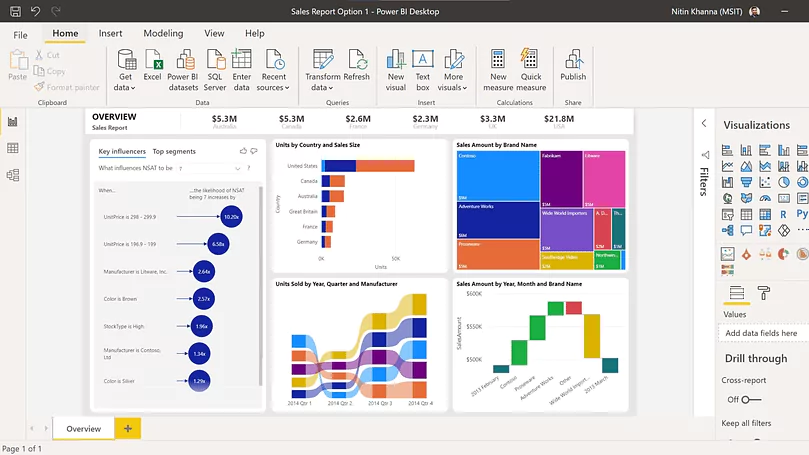
Power BI is a data analysis and mining tool developed by Microsoft, known for its integration capabilities and ease of use. Here’s an in-depth look at Power BI:
Key Features of PowerBI:
- Strong Integration with Microsoft Ecosystem: Being a member of the Microsoft toolkit, Power BI enjoys seamless integration with other Microsoft products and services. Thus enhancing its functionality.
- User-Friendly Interface with Natural Language Capabilities: Power BI allows users to create reports and analyze data using natural language queries.
- Interactive Reports and Mobile Accessibility: You can create interactive reports and dashboards with Power BI and access them from multiple devices.
- Affordable Options: Power BI offers a free personal version with some limitations.
- Scalability: Scales well for businesses of different sizes.
Cons:
- Limited Data Discovery Capabilities: Some users find that Power BI’s data discovery capabilities are not as advanced as those of other BI tools.
- Advanced Data Modeling May Require Learning DAX: To make the most of Power BI’s data modeling capabilities, users may need to learn Data Analysis Expressions (DAX).
- Not Supported on Mac Devices: Power BI is not supported on Mac devices, which could be a limitation for Mac users.
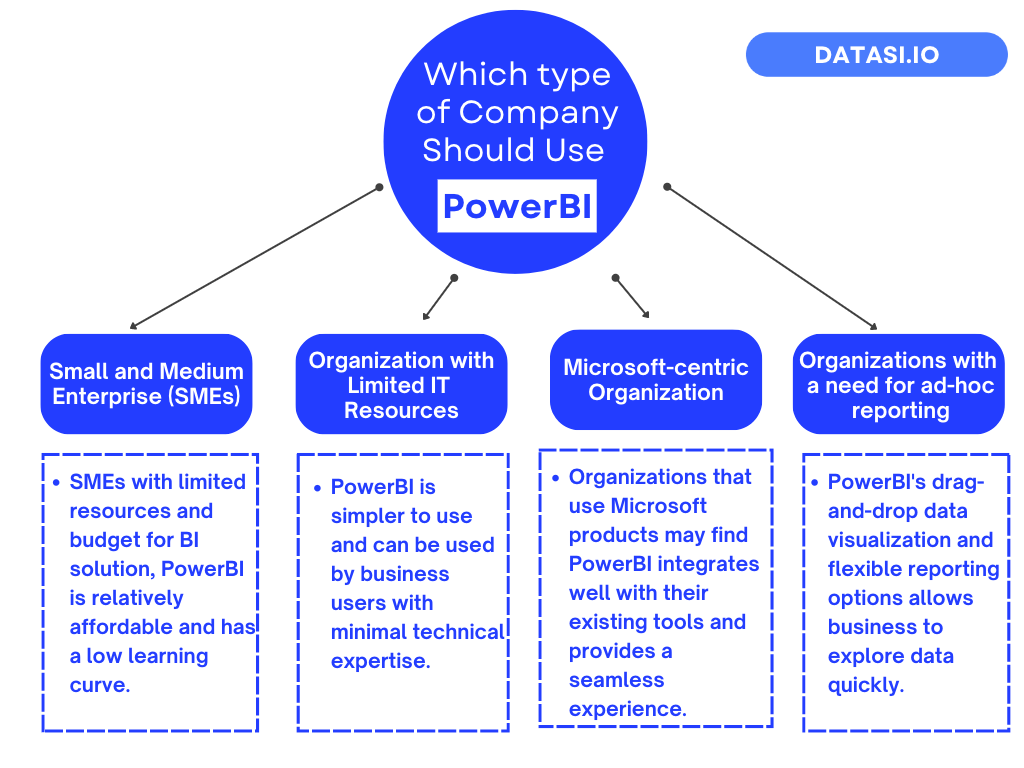
In summary, Microsoft Power BI provides data visualization and analysis capabilities, making it suitable for organizations seeking a simple, straightforward BI solution that offers a good balance between functionality and cost.
We recommend the following companies adopt Power BI for their BI strategy.
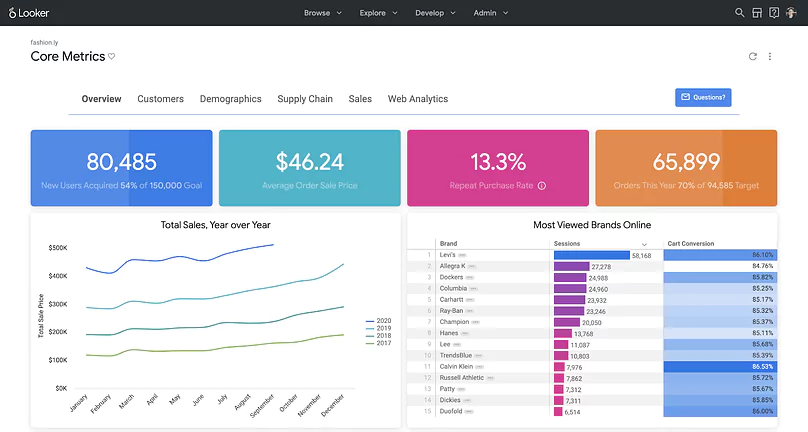
3. Looker
Looker is a cloud-based BI platform that offers a data modeling layer and enables you to create custom reports and dashboards tailored to your specific needs.
Key Features of Looker:
- Advanced Data Discovery and Modeling: Looker excels in advanced data discovery, analysis, and modeling functions.
- Centralized Data View: It provides a consistent view of data across the organization.
- Custom Reporting: Looker allows users to create custom reports and dashboards tailored to specific needs.
- High Flexibility: Looker has robust API and integration capabilities.
- Scalability: Scales well with businesses dealing with large volumes of complex data.
Cons:
- Steeper Learning Curve: Looker may have a steeper learning curve, requiring a higher level of technical expertise.
- Limited Data Visualization Capabilities: Some users find that Looker’s data visualization capabilities are not as extensive as those in other BI tools.
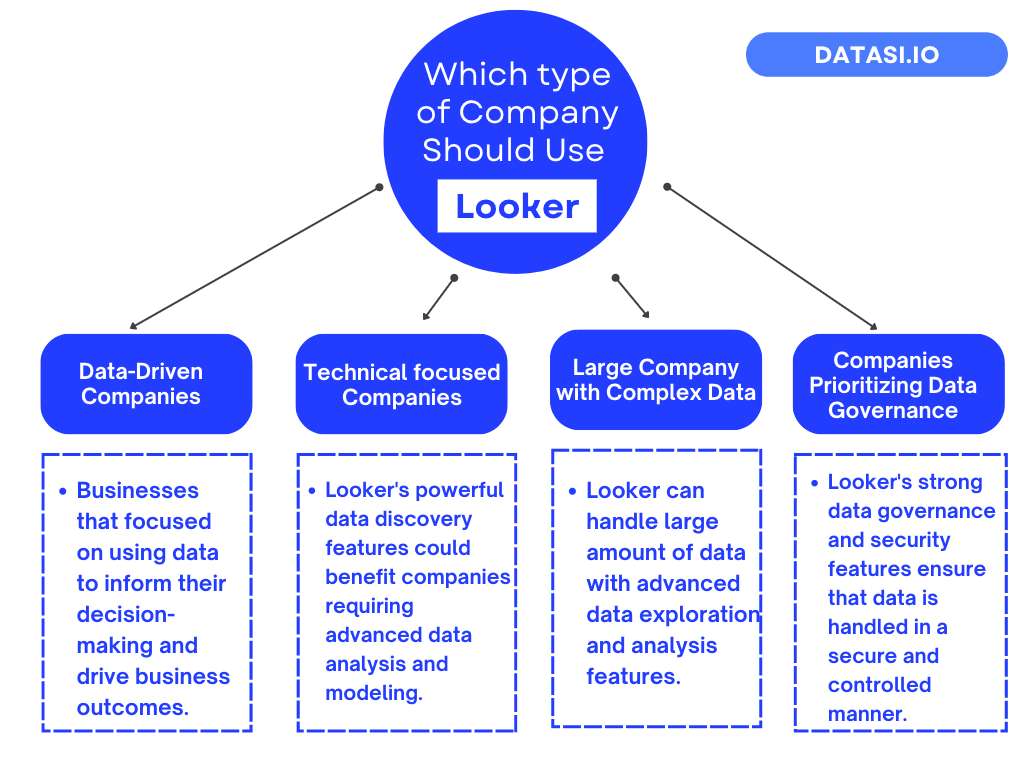
In summary, Looker provides advanced data discovery and visualization capabilities, making it suitable for organizations dealing with a high volume of complex data and requiring advanced data analysis and exploration features.
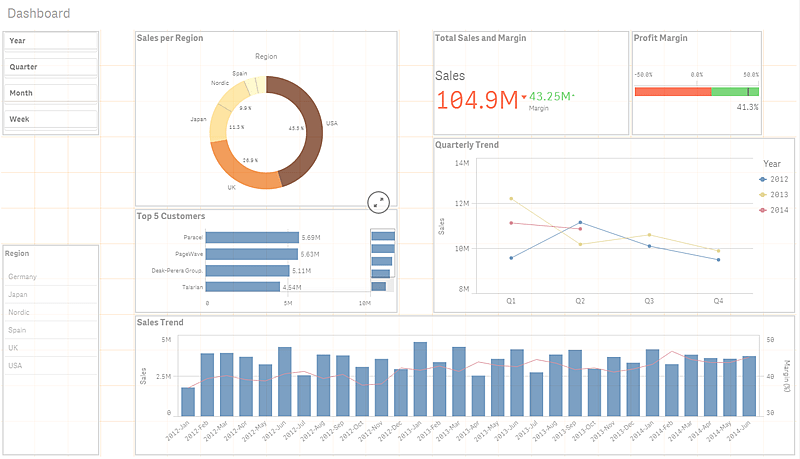
4. QlikView
QlikView is known for its self-service analytics, real-time analysis, and flexibility. Here’s an in-depth guide to QlikView:
Key Features of QlikView:
- Self-Service Analytics: QlikView empowers users with self-service analytics, which means individuals can explore and work with the data independently without the need for extensive technical or IT support.
- Real-Time Analysis: It supports real-time analysis and decision-making, which can be valuable for businesses that need up-to-the-minute insights.
- Flexible Deployment: Offers flexibility in deployment options to suit different business needs.
- Handles Large and Complex Datasets: QlikView can efficiently handle large and complex datasets.
Cons:
- Monthly Cost May Be Expensive: The monthly cost of using QlikView may be relatively high, approximately $30 per month, which could be a limitation for small businesses.
- Steeper Learning Curve: Users may find that QlikView has a steeper learning curve, especially for those new to BI tools.
- Limited Integration Abilities: Some users may encounter challenges when integrating QlikView with other tools or systems.
In summary, QlikView provides data visualization and analysis capabilities, making it suitable for organizations in need of a robust and scalable BI solution with advanced data discovery and exploration features.

Factors to Consider When Selecting BI Tools
When choosing a BI tool, it is essential to consider its compatibility with your business and requirements.
Several factors should be taken into account, including:
1. Cost
Cost is a common consideration for SME owners when selecting a data solution. It is important to invest in tools that align well with your organization and provide returns in both the short and long term.
While it is natural to be cost-sensitive, being overly focused on cost can sometimes lead to missed opportunities.
BI tools can bring significant efficiency gains, providing insights faster and acting as a 24/7 analytics team with minimal maintenance.
With proper planning and setup, BI tools can deliver substantial benefits to your business and could be one of your most strategic investments.
2. Functionality
Functionality is another critical factor to consider.
As we recommend above, different companies with varying data sizes and requirements may find different tools more suitable. For example, if interactive and visually appealing dashboards and reports are important to you, Tableau might be a better choice.
Additionally, consider tools that are user-friendly, requiring minimal technical skills to operate, for both you and your team.
Compatibility with your existing tools is also worth considering. Ensure that the BI tool can integrate with other systems, such as your CRM or ERP, to ensure up-to-date and accurate data in your reports and dashboards.
Integration can enhance operational efficiency, eliminate manual data transfer, and reduce the risk of errors.
If team collaboration is important, assess whether the tool integrates with your project management software or team communication platforms to ensure smooth collaboration.
3. Scalability
A better tool is a tool that can address your current needs while accommodating future growth.
Consider whether the tool can handle your growing data and user requirements as your business expands. Evaluate its suitability for team collaboration, ensuring it can support effective collaboration as your team grows.
4. Data Source Compatibility
Data source compatibility is crucial. Assess whether the BI tool can connect to and extract data from your existing sources, such as databases, spreadsheets, or cloud services.
5. Reliable Customer Support
Lastly, look for a tool that offers reliable customer support in case of any issues or challenges that may arise.
We recommend requesting demos and trials of the selected BI tools to better understand how they work and whether they meet your specific needs before making a purchase decision.
Proper planning and setup, coupled with a well-chosen BI tool, can make data strategy effective and sustainable.
Integrating BI Tools into Your Business
Once you have selected the right BI tool for your business, it’s time to set it up and get it to work for you.
Setting up a BI tool for automated reporting typically involves several steps. Here’s a suggested framework for the process:
- Define Reporting Requirements: Identify the key metrics, KPIs, and data sources that need to be included in the reports. Consider the frequency, format, and distribution of the reports.
- Data Integration and Preparation: Connect your BI tool to the relevant data sources, such as databases, spreadsheets, or cloud services. Ensure that the data is clean, accurate, and properly structured for reporting. Read more here to learn about data quality.
- Design Report Templates: Create report templates in your BI tool that align with your desired format and layout.
- Set Up Data Refresh Schedule: Configure the BI tool to automatically refresh the data at defined intervals or triggers. Schedule data updates based on the frequency of your reports and the availability of new data.
- Implement Automated Report Generation: Leverage the automation capabilities of your BI tool to generate reports automatically at your desired intervals and specify the recipients.
- Validate and Review Reports: Review the reports to ensure they meet the intended requirements and provide the desired insights.
- Monitor and Maintain: Regularly monitor the automated reporting process to ensure that data refreshes and report generation occur as planned.
Unlock the Power of BI Tools
Ready to revolutionize your reporting and data analysis processes to the next level? Book a consultation with our experienced data experts.
We’ll guide you through the selection and implementation of the perfect BI tool for your business, ensuring automated reporting and actionable insights.
Unlock the potential of your business today.

Talk to us today
Find out how we can help your business to build a successful data strategy.