
We are surrounded by data but starving for insights.
In today’s business world, turning data into valuable insights is the key to standing out.
Data analytics isn’t just for big players—it’s your secret weapon too. Imagine understanding your business better: knowing what your customers love, making smarter decisions, and finding new paths to success. That’s the magic of data analytics.
Here’s the thing: You know data matters, but you might wonder, “How can we use our data effectively?” or “What tools can help us make sense of it all?“
Don’t worry; we’ve got you covered.
In this article, we’re introducing the best data analytics tools for small businesses. These tools will help you unlock the potential of your data and take your business to new heights.

What are the Challenges for Small Business Data Analytics?
Small businesses may encounter several hurdles in their quest for effective data analytics tools:
- Limited Resources and Expertise: Small businesses typically have constrained budgets, making it challenging to invest in advanced analytics tools, hire specialized personnel, or allocate funds for data-related initiatives.
- Data Quality and Security: Ensuring data accuracy and completeness can be difficult due to limited resources for data collection, cleaning, and maintenance.
- Choosing the Right Tools: Selecting appropriate analytics tools can be overwhelming, given the wide array of options available. Small businesses need to find tools that align with their needs, budget, and level of technical expertise.
- Integration Challenges: Integrating data from various sources and systems can be complex, especially if there’s a lack of standardized data formats or if existing systems are not compatible with modern analytics tools.
- Scalability: As a business grows, its data analytics needs also evolve. Ensuring that chosen analytics solutions can scale to accommodate increasing data volumes and complexity is essential.
- ROI Justification: Small businesses need to demonstrate a clear return on investment (ROI) for their data analytics efforts. Measuring the impact of analytics initiatives and attributing results to data-driven decisions can be challenging.
- Regulatory Compliance: Adhering to data protection regulations, such as GDPR or CCPA, is critical. Small businesses might struggle to stay compliant due to limited legal and compliance resources.
- Data Overload: Even with limited resources, small businesses can find themselves overwhelmed by the sheer volume of data. Extracting meaningful insights from the noise can be a challenge.
Considering the challenges faced by small businesses mentioned above, we will help you step-by-step on how to choose data analytics tools or software that are best suited for your specific business scenario.
Key Insights for Small Business Owners
Getting the most out of your data starts by recognizing your business needs and choosing the right tools.
You might be under the impression that data analysis requires a deep understanding of complex methods, which can be overwhelming.
But fear not, because mastering data analysis is attainable, even with limited resources. Once you find the right tool that aligns with your needs, you’ll be able to achieve your data goals. This includes everything from collecting and processing data to analyzing and visualizing it.
The result? Valuable insights that pave the way for informed, data-driven decisions.
7 Types of Data Analytics Tools for Small Businesses
When we talk about data analytics tools, there’s a variety of options available, each designed to handle different aspects of the process.
Here are mainly 7 types of data analytics tools each serving different purposes:
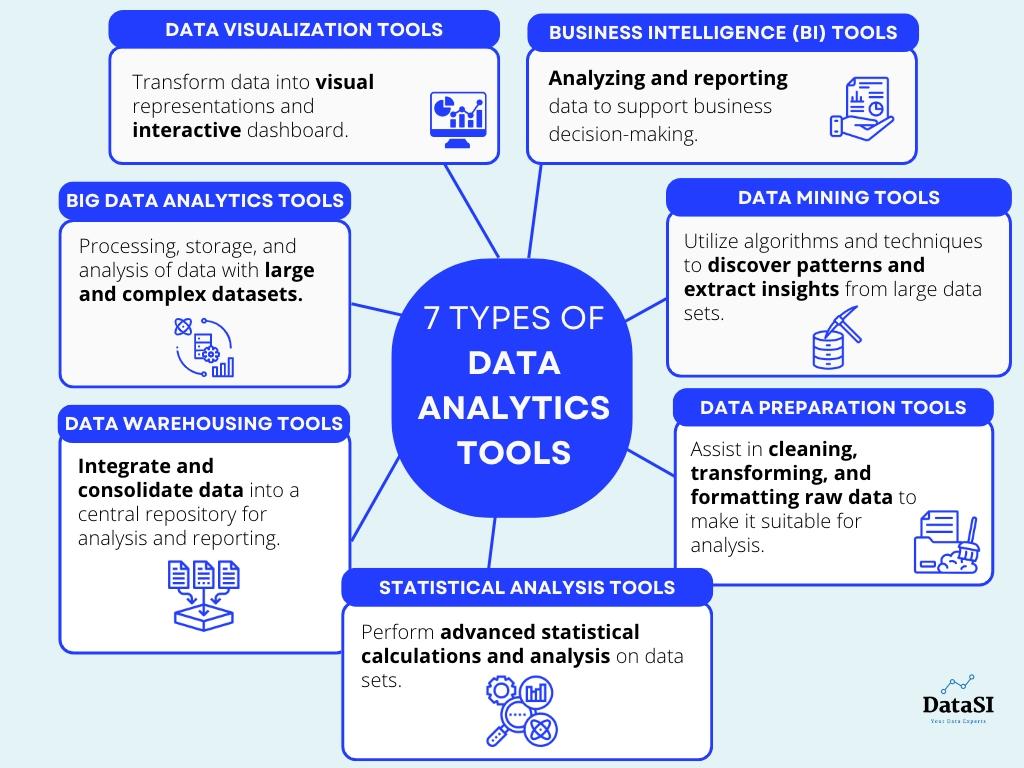
1. Data Visualization Tools: These tools help transform data into visual representations such as charts, graphs, and interactive dashboards. They make it easier to understand and interpret complex data sets, identify patterns, and communicate insights effectively. Examples include Tableau, Microsoft Power BI, and QlikView.
2. Business Intelligence (BI) Tools: BI tools focus on analyzing and reporting data to support business decision-making. They offer features for data integration, querying, and reporting, allowing users to explore and analyze data from various sources. Examples include Microsoft Power BI, SAP BusinessObjects, and Oracle Business Intelligence.
3. Big Data Analytics Tools: These tools are specifically designed to handle large and complex data sets, often referred to as big data. They provide capabilities for distributed processing, storage, and analysis of data using technologies like Apache Hadoop, Apache Spark, and NoSQL databases.
4. Statistical Analysis Tools: Statistical analysis tools are designed to perform advanced statistical calculations and analysis on data sets. They provide functionalities for hypothesis testing, regression analysis, clustering, and other statistical modeling techniques. Examples include R, Python (with libraries such as NumPy and pandas), and IBM SPSS.
5. Data Mining Tools: Data mining tools utilize algorithms and techniques to discover patterns and extract insights from large data sets. They help identify hidden relationships, perform predictive analysis, and uncover trends or anomalies in the data. Examples include RapidMiner, KNIME, and IBM Watson Analytics.
6. Data Warehousing Tools: Data warehousing tools facilitate the extraction, transformation, and loading (ETL) of data from different sources into a central repository. They enable businesses to integrate and consolidate data for analysis and reporting purposes. Examples include Informatica PowerCenter, Microsoft SQL Server Integration Services (SSIS), and Oracle Data Integrator.
7. Data Preparation Tools: Data preparation tools assist in cleaning, transforming, and formatting raw data to make it suitable for analysis. They automate data cleansing tasks, handle missing values, and standardize data formats. Examples include Alteryx, Trifacta, and Talend
When selecting the right data analytics software for your needs, consider these four key factors:
- Budget
- Ease of use
- Compatibility with your business data and requirements
- Scalability for future growth
Now, let’s dive into the recommended tools one by one, taking into account these four dimensions.
Data Analytics Tools for Small Business
The first tool we want to introduce is Excel.
1. Excel
Excel is often associated with spreadsheets, but it offers much more than that.
It’s a versatile data analysis tool that includes features like pivot tables, data cleaning, predictive analysis, data visualization, VBA (Visual Basic for Applications), and advanced dashboard creation.
If you’re working in a small to medium-sized enterprise (SME) and are proficient in Excel, you can accomplish a lot of data analysis tasks solely with Excel.
Pros:
- Familiarity: Most of us are frequent users of Microsoft Suites including Excel, reducing the learning curve and enabling quick adoption.
- Cost-effective: Excel is often included in standard office suites, which makes it a cost-effective choice for small businesses.
- Ease of Use: Excel is user-friendly and widely accessible. Creating basic charts, graphs, and tables is straightforward, making it accessible to users with minimal technical skills.
- Basic Analysis: Excel provides a range of built-in functions and tools for basic data analysis. Small businesses can perform tasks like calculations, sorting, filtering, and creating charts without needing advanced skills.
- Ease of Integration with Microsoft Access: Excel can be integrated with Microsoft Acess, a database management system from Microsoft, which allows you to store your data safely.
- Customizable Reports: Users can create customized reports and dashboards using Excel’s formatting and visualization features, allowing them to present data in a visually appealing manner.
Cons:
- Limited Scalability: Excel becomes less efficient with larger datasets, leading to slower performance and potential crashes.
- Lack of Advanced Analytics: Complex statistical analyses, machine learning, and predictive modeling capabilities are beyond Excel’s scope. Complex calculations might require manual scripting or the use of external plugins.
- Version Control Issues: Managing multiple versions of files shared among team members can lead to confusion and errors.
- No Real-Time Updates: Real-time updates are not a native feature of Excel. It primarily operates in a manual or semi-manual mode. If you want to achieve real-time updates from an external data source, you need to do some workarounds and combine external tools. For frequent data updates, a real-time analytics tool (which we’ll discuss below) could be more suitable.
- Data Security: Excel lacks robust security features, which can be a concern when dealing with sensitive business data. Unauthorized access and data breaches are potential risks.
As your business grows, Excel’s limitations might become more apparent. Excel might not scale well to meet these evolving demands, leading to the need for more advanced software.
Usage Scenario for Small Business Data Analytics:
Small business owners can use Excel for various data analytics tasks, such as:
- Sales Analysis: Small businesses can use Excel to track sales trends over time, calculate total revenue, and create visual charts to showcase performance. For example, a small retail business can use Excel to track monthly sales, analyze popular products, and visualize sales trends through basic charts.
- Financial Tracking: Creating spreadsheets to monitor income, expenses, and cash flow.
- Data Visualization: Generating straightforward and simple charts and graphs to present data visually.
- Inventory Management: Excel can help businesses maintain inventory records, track stock levels, and generate alerts when items need to be restocked.
- Customer Segmentation: By sorting and filtering customer data, businesses can segment their customer base based on demographics or purchase behavior, allowing for targeted marketing campaigns.
- Social Media Engagement: Small businesses can analyze social media engagement metrics using Excel. They can track likes, shares, and comments to measure the success of their online campaigns.
- Marketing ROI: Excel can calculate the return on investment (ROI) for marketing campaigns by comparing the costs incurred to the revenue generated.
2. Programming Languages (SQL, Python, R)
Programming languages like SQL, Python, and R are widely used by data analysts. They can provide more robust data manipulation, analysis, and modeling capabilities compared to Excel.
SQL
Structured Query Language (SQL) is a powerful domain-specific programming language used for managing relational databases and performing various data operations.
Many enterprises deal with massive amounts of data stored in databases, and SQL provides the means to access and clean this data.
Pros:
- Efficient Data Retrieval: SQL is optimized for database operations, making it highly efficient for retrieving and manipulating data from databases.
- Data Organization: It allows for structured data storage, making it easier to manage and query large datasets.
- Data Integrity: SQL enforces data integrity rules, ensuring that data remains accurate and consistent.
- Standardized Language: SQL is a widely used and standardized language for relational databases, ensuring compatibility across different systems.
- Easier in Adoption: SQL is often considered the easiest programming language to get started with, and there are numerous free online resources available.
- Scalability: SQL databases can handle large volumes of data efficiently, making it suitable for businesses with growing datasets.
Cons:
- Limited Analysis Capability: While SQL is excellent for data retrieval and manipulation, it lacks the advanced analysis and visualization capabilities of Python and R.
- Lack of Customization: Complex analytics and custom calculations might require additional programming in other languages.
- Steep Learning Curve: Learning SQL requires an understanding of database concepts, which might pose a challenge for users without prior experience.
While mastering the basic functions of SQL can be achieved in just 2 to 3 weeks, new coders may face occasional challenges.
It is important to note that if your business does not currently involve a database, learning SQL may not be necessary at the outset.
Usage Scenario for Small Business Data Analytics:
- Data Retrieval: Small businesses can use SQL to extract relevant data from their databases, helping inform decision-making.
- Reporting: SQL can be used to generate standardized reports on sales, inventory, or customer data.
- Sales Analysis: Small businesses can use SQL to analyze sales data, extract insights about top-selling products, and calculate revenue by different parameters.
- Customer Segmentation: SQL can help segment customers based on buying behavior, allowing businesses to tailor marketing strategies.
- Inventory Management: Businesses can use SQL to monitor inventory levels and automate alerts for restocking items.
Python
Python is another widely used high-level, general-purpose programming language that offers exceptional capabilities for data analytics.
It provides an extensive range of packages that facilitate faster and easier data handling, particularly in statistical and predictive analysis. Python is also popular among data scientists for tasks such as model development, web crawling, and game development.
Pros:
- Versatility: Python is a general-purpose language, allowing for data analysis, scripting, web development, and more.
- Rich Ecosystem: Python has extensive libraries (NumPy, Pandas, Matplotlib, etc.) that facilitate data manipulation, analysis, and visualization.
- Advanced Analysis Capabilities: Python’s machine learning libraries (Scikit-Learn, TensorFlow, etc.) enable predictive modeling and data-driven insights.
- Free Language: Python is open-source and free to use. The language itself doesn’t have direct costs.
- Community Support: Python has a large and active community, resulting in abundant resources and solutions.
Cons:
- Learning Curve: While Python is beginner-friendly, mastering its data analysis capabilities might take time, especially for more advanced tasks.
- Code-Intensive: Data analysis in Python requires writing code, which might be intimidating for non-programmers.
- Performance: Python can be slower than lower-level languages like C++ for certain computationally intensive tasks.
However, if your use of Python is not for a large-scale project, it’s worth considering the time investment required to learn the language.
Usage Scenario for Small Business Data Analytics:
- Data Cleaning and Transformation: Python’s Pandas library is invaluable for cleaning and transforming messy data.
- Advanced Analysis: Small businesses can conduct complex analyses using Python’s data analysis libraries.
- Marketing Campaign Analysis: Python can help analyze campaign performance, predict customer behavior, and optimize marketing strategies.
- Financial Analysis: Businesses can use Python to create financial models, perform trend analysis, and generate forecasts.
- Customer Churn Prediction: Python’s machine learning libraries can be employed to predict customer churn based on historical data.
- Visualization: Python’s Matplotlib and Seaborn libraries can create visually appealing charts and graphs for presentations.
R
Lastly, R is a programming language specifically designed for statistical computing and graphics.
Pros:
- Statistical Analysis: R is designed for statistical analysis, making it powerful for hypothesis testing, regression analysis, and more.
- Data Visualization: R has excellent data visualization capabilities, enabling businesses to create informative graphs and charts.
- Specialized Packages: R offers a wide range of specialized packages for various analytics needs, including linear modeling, time series analysis, and more.
- Wide Resources: The comprehensive library in R offers extensive support, ensuring that answers to any coding questions can be found within the library’s functions
- Affordable: Similar to Python, R is open-source and free to use as a programming language.
Cons:
- Niche Use: R is primarily used for statistical analysis, which might limit its versatility compared to languages like Python.
- Learning Curve: Like Python, R requires learning its specific syntax and concepts. Mastering a new programming language like R requires a significant time commitment, especially for those who are new to coding.
Usage Scenario for Small Business Data Analytics:
- Statistical Analysis: Small businesses can perform in-depth statistical analysis on customer behavior, sales trends, or product performance.
- Market Research: R can analyze survey data, perform regression analysis, and visualize trends in market research.
- A/B Testing: Small businesses can use R to analyze the results of A/B tests and make data-driven decisions.
- Healthcare Analytics: R’s statistical capabilities make it suitable for analyzing healthcare data, such as patient outcomes and medical research.
In summary, you can benefit from the above tools when dealing with more extensive datasets or requiring advanced analysis. SQL can help manage databases, while Python and R can offer custom solutions for specific business challenges.
You should consider your specific needs, technical resources, and learning curve when selecting the most appropriate tool for your data analytics tasks.
3. Web Analytics Tools
Web analytics tools, such as Google Analytics, track website traffic, user behavior, and engagement metrics.
It provides valuable insights into web traffic, customer origins, marketing efforts, and detailed demographic, interest, and behavioral breakdowns of website visitors.

Pros:
- User-Friendly Interface: Google Analytics offers an intuitive interface that is relatively easy for users to navigate, making it accessible to individuals with varying levels of technical expertise.
- User Insights: It provides comprehensive insights into website traffic, user behavior, and conversion rates. This data is crucial for understanding how customers interact with the business’s online presence.
- Real-time Tracking: Google Analytics offers real-time tracking of website activity, enabling businesses to monitor events and responses as they happen.
- Goal Tracking: Measurement of specific actions, such as sign-ups or purchases, helps evaluate the effectiveness of marketing campaigns. By identifying high-performing areas, such as popular products or engaging posts, businesses can focus their efforts more effectively.
- Cost-effective: The core version of Google Analytics is free and provides essential website tracking features.
- Integration with Other Tools: Google Analytics can be integrated with other Google products such as Google Ad, Google Search Console, and third-party tools. It gives a quite comprehensive picture of your online effort and cost.
Cons:
- Limited to Online Data: Web analytics tools focus exclusively on online metrics, excluding offline data from consideration.
- Privacy Concerns: Compliance with data protection regulations is essential when dealing with customer data.
Usage Scenario for Small Business Data Analytics:
- Website Performance Analysis: Google Analytics can help small businesses analyze website traffic, user engagement, and bounce rates. For example, an e-commerce business can track which products are viewed most often and optimize their product pages accordingly.
- Conversion Rate Optimization: By monitoring conversion funnels, businesses can identify where users drop off in the purchasing process and take steps to improve those areas.
- Content Effectiveness: Google Analytics helps measure the success of different types of content. For instance, a blog-based business can analyze which blog posts attract the most visitors and engagement.
- Campaign Tracking: Small businesses running online marketing campaigns can use Google Analytics to track the effectiveness of various channels, such as social media, email, and pay-per-click advertising.
- Mobile App Analysis: If a business has a mobile app, Google Analytics for Firebase can provide insights into user behavior, app usage, and retention rates.
- Geographical Insights: Businesses can understand their audience’s geographical locations and tailor marketing strategies accordingly. For instance, an event-based business can see where its website traffic is originating and plan local events in those areas.
- User Behavior Analysis: By analyzing user paths on the website, businesses can optimize user experience and encourage desired actions.
Want to gain better marketing insights from your data? Talk to a data expert today.

Talk to us today
Find out how we can help your business to build a successful data strategy.
4. Business Intelligence (BI) Tools
Lastly, the tool we recommend for everyone is Business Intelligence (BI) Tools. It’s essential for any enterprise going for digital transformation.
These tools effectively integrate data from various sources within an enterprise, presenting it in a simplified manner to aid in decision-making.

The 2 tools we want to introduce here are Microsoft Power BI and Tableau.
Microsoft Power BI
Microsoft Power BI is a data analysis and mining tool developed by Microsoft that allows users to create and share interactive reports, visualizations, and dashboards while enabling collaboration and real-time data insights.
Users can combine a group of dashboards and reports into a Power BI app for simple distribution and viewing on multiple devices. It allows easy sharing and collaboration between team members. Also, allows you to view real-time data insights.
Pros:
- User-Friendly Interface: Power BI’s intuitive interface allows users to create interactive reports and dashboards without advanced technical skills.
- Integration with Microsoft Suite: If your business uses Microsoft products, Power BI seamlessly integrates with tools like Excel and SQL Server.
- Interactive Dashboards: Power BI enables you to create interactive real-time dashboards that allow users to explore data and gain insights.
- Data Transformation: Power BI offers data transformation capabilities through Power Query, enabling users to clean and shape data from various sources.
- Strong Data Modeling: It supports robust data modeling and relationships, which is important for creating complex reports and interactive visualizations.
- Cost-Effective: The Power BI Desktop application is free, while additional features and cloud-based sharing require subscription plans. This can be cost-effective for small businesses.
Cons:
- Limited Advanced Analytics: While Power BI supports some basic calculations, it’s not as comprehensive for advanced statistical analysis or predictive modeling compared to other tools.
- Learning Curve for Complex Reports: Creating complex reports and visualizations might require a steeper learning curve.
- Limited Customization: Compared to Tableau, Power BI’s customization options for visualizations and dashboards might be somewhat limited.
- Not Compatible with MacBook: Power BI Desktop is designed to run on Windows operating systems. If you are a macOS user, you need to do some workarounds to use the tool.
Usage Scenario for Small Business Data Analytics:
- Sales Analysis Dashboard: Create an interactive dashboard that shows your sales trends, top-selling products, and customer distribution.
- Operational Insights: Track inventory levels, supplier performance, and operational metrics to optimize your supply chain.
- Marketing Performance: Analyze the effectiveness of your marketing campaigns by visualizing website traffic, social media engagement, and conversion rates.
- Financial Reporting: Generate visually appealing financial reports that highlight your revenue, expenses, and profit margins.
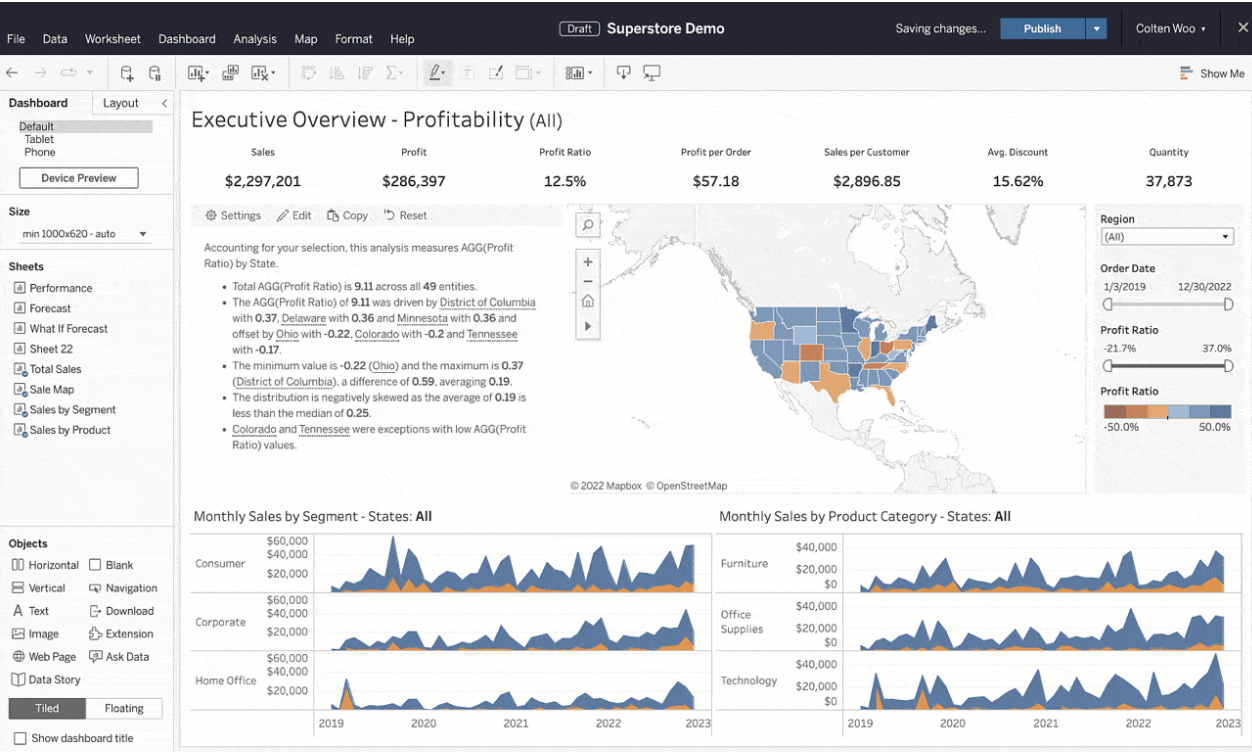
Tableau
Tableau is another powerful data visualization and BI tool that helps organizations transform raw data into interactive and visual insights.
Pros:
- Powerful Visualizations: Tableau excels at creating visually stunning and interactive charts, graphs, and maps.
- Data Integration: It can connect to various data sources, enabling you to consolidate information from different systems.
- Advanced Analytics: Tableau offers more advanced analytical features, making it suitable for businesses that require complex statistical analysis and predictive modeling.
- User Community: Tableau has a strong user community, offering a wealth of tutorials, resources, and templates.
- Scalability: It’s capable of handling large datasets and complex analytics tasks effectively.
- Customization: Tableau provides extensive options for customizing visualizations to suit your specific business needs.
Cons:
- Costly: Tableau can be relatively expensive, especially for small businesses with tight budgets. Licensing costs and subscription plans can add up.
- Steeper Learning Curve: While Tableau’s interface is user-friendly, mastering its advanced features might take time, particularly for users new to data analytics.
Usage Scenario for Small Business Data Analytics:
- Customer Segmentation: Use Tableau to visually segment your customer base based on demographics, behaviors, or purchasing patterns.
- Geographical Insights: Create a map visualization to show where your customers are located and analyze regional sales trends.
- Performance Dashboards: Design a dashboard that tracks key performance indicators (KPIs) such as revenue, customer satisfaction, and website traffic.
- Marketing Campaign Analysis: Tableau can help analyze the effectiveness of marketing campaigns, allowing businesses to make data-driven decisions to optimize their strategies.
- Predictive Analytics: Utilize Tableau’s capabilities to forecast future sales or demand based on historical data.

[mailerlite_form form_id=3]
The above are the data analysis tools we want to introduce today, and you can choose according to your business needs and requirements.
Learning data analysis can be a steep learning curve from the start and requires a lot of time investment. Our data experts are here to help SME owners like you in implementing a sustainable data strategy.
We’ll collaborate to understand your business goals, identify your data needs, select the right tools based on your long-term objectives and budget, and bring your data solution to life.
Get in touch with our data experts today to unleash the potential of data analytics in your company.
Talk to us today
Find out how we can help your business to build a successful data strategy.